Data Review
Revision as of 17:09, 20 May 2020 by Cody Gallagher (talk | contribs) (Protected "Data Review" ([Edit=Allow only administrators] (indefinite) [Move=Allow only administrators] (indefinite)))
Data View allows you to look at daily and monthly data under by groups that can be set up multiple ways and shared to other users.
Site List
The site list is controlled by the set options in Site List Options:
- Group
- The main selection will control what sites are initially pulled in. In order to select a group first it must be set up in Group Maintenance
- View By
- Once the group is set then select what identifier you want to sort by.
- User_ref - The Name for the site that is set for PRAMS, for company use.
- Site Name - The official name for the well that appears on any regulatory reporting.
- Acct Id - Accounting Id that is set under the company tab in analyst.
- Econ Id - Economic Id this is set under the company tab in analyst under acct id.
- Once the group is set then select what identifier you want to sort by.
- Find
- Use this section to find a site withing the list. Type in letters or numbers and use the down arrow to snap to the correct well and double click it to display.
Viewing Data
- There are multiple ways to view data in Data View:
- Select a Site - you can simply double click a well to view its data.
- Sum Selected Sites - By clicking one site then holding down shift or control then selecting the button, you can summon multiple sites to view at once.
Daily/Monthly Charts
- The Daily chart will show any data that has been input into pumper and synced across. This data can be viewed in the Daily Data tab. Monthly will have all the same options minus the date range selector.
- When you select a well it will populate the chart and from there you can set chart options by clicking 'View Chart Options'. These changes will be saved upon exit.
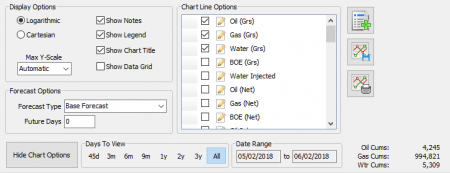
- Display Options - Will allow you to select Logarithmic or Cartesian. You can set the Y-Scale to be automatic or a number that is consistent. This area will also show Notes, Legends, Chart Title, and the Data Grid.
- Forecast Options - This section you can select a forecast and set how many days ahead you want to view on the chart. To set up a forecast view Forecast.
- Days to View - By selecting a range from 45 days to 3 years back from current day or All range you can see in the Date range what daily data is being viewed in the chart. The cum volume will appear to the right.
- By clicking and holding down in the chart you can select a range of data manually by dragging between two date ranges, doing this will zoom in to the highlighted area. Hovering over the chart with the cursor will display data above the chart.
- Chart Line options - Selecting more options will add lines to the chart and thus the legend. To customize a line select the icon to the right of the check box. The following will appear:


Daily/Monthly Data
- Here you can view all the values for the well on a daily or monthly basis. The columns van be customized and the data can be exported.
- Daily Data - Shows each day descending for the selected site or sites. You can also see the Daily Test Data below, both are exportable. If you so not see data in this section it has not been input into PumperX2.
- Monthly Data - Shows the period and total volume for all the completed months. If you do not see data here it has not been completed in Production Entry.
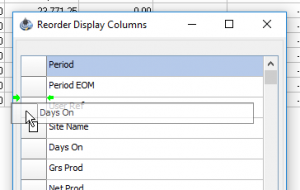
- Both tabs allow you to add columns under 'Data Columns To Show' drop-down. Once Selected you can reorder the columns by selecting the
 then dragging the handles above or below one another.
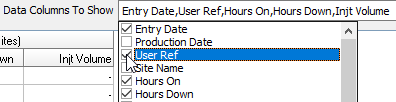


Copyright © 2026 by PRAMS Plus LLC. All Rights Reserved.