Difference between revisions of "List of Tasks"
Jump to navigation
Jump to search
| Line 14: | Line 14: | ||
|- | |- | ||
|7 Day Prod/w Cums | |7 Day Prod/w Cums | ||
| − | | | + | | Will display the last seven days with average, total production, and monthly cum. |
|[[File:7 Day Prod With Cums.png|thumbnail]] | |[[File:7 Day Prod With Cums.png|thumbnail]] | ||
|- | |- | ||
|'''Auto Fill Daily Shut In''' | |'''Auto Fill Daily Shut In''' | ||
| − | | | + | | This task will fill in the gauge sheet in PumperX2 if the day previous has 24 hours down and is Shut In. |
| + | |||
| + | It will generate a report that shows the count of how many sites this was applied to. | ||
| | | | ||
|- | |- | ||
|Custody vs Check Report | |Custody vs Check Report | ||
| − | | | + | | Showing the last 7 days of production for sales compared to the check meter reading. |
| + | |||
| + | Will provide a difference in total MCF and in %. | ||
|[[File:Custody vs Check Report.png|thumbnail]] | |[[File:Custody vs Check Report.png|thumbnail]] | ||
|- | |- | ||
|Daily Allocation | |Daily Allocation | ||
| − | | | + | | Automatically runs allocation for anything that is set up to allocate. Can be set up to run Once, Daily, Weekly, or Monthly. |
| + | |||
| + | Can be set to Default or Enhanced logging. | ||
| + | |[[File:Manage Schedule Tasks Daily Alloc.png|thumbnail]] | ||
|- | |- | ||
|Daily Allocation (Catch Up) | |Daily Allocation (Catch Up) | ||
| − | | | + | | Allocates all or user set sites for one month set in a date rage as mm/02/yy - mm/01/yy. The more sites, the longer this allocation will run. |
| + | |||
| + | Set this allocation to run monthly towards the end of the work day. | ||
| + | |||
| + | Can be set to Default or Enhanced logging. | ||
| + | |[[File:Manage Schedule Tasks Daily Alloc Catch Up.png|thumbnail]] | ||
|- | |- | ||
|Daily Flare Report | |Daily Flare Report | ||
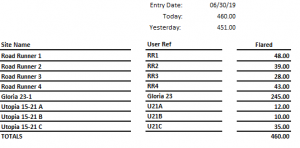
| − | | | + | | Will send a report that will show total flared volume broken down by site. Also shows the previous volume total. |
| + | |[[File:Manage Schedule Tasks Daily Flare Report.png|thumbnail]] | ||
|- | |- | ||
|Daily Injection Report | |Daily Injection Report | ||
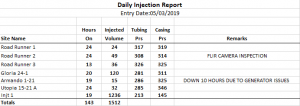
| − | | | + | | Will generate a report that will show the injected volume, hours on, remarks, tubing pressure, and casing pressure. |
| + | |[[File:Manage Schedule Tasks Daily Inj Report.png|thumbnail]] | ||
|- | |- | ||
|Daily Production (Simple) | |Daily Production (Simple) | ||
| − | | | + | | A simplified version of Daily Production Report, that shows hours on/off, daily volumes, pressures, stroke data, and remarks. |
| + | |[[File:Manage Schedule Tasks Daily Simple.png|thumbnail]] | ||
|- | |- | ||
|Daily Production Alert | |Daily Production Alert | ||
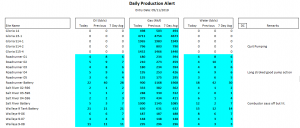
| − | | | + | | Will show any set triggers set in [[Global Settings]]. |
| + | |[[File:Manage Schedule Tasks Daily Prod Alert.png|thumbnail]] | ||
|- | |- | ||
|Daily Production Charts | |Daily Production Charts | ||
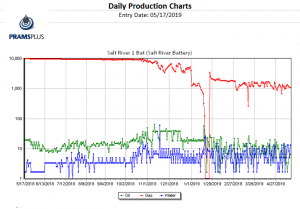
| − | | | + | | Displays a report that shows the production data for a site. The data displayed is a year back from the date specified. |
| + | |||
| + | There are 5 total variants for this task and supports logo use. | ||
| + | |[[File:Manage Schedule Tasks Daily Prod Charts.png|thumbnail]] | ||
|- | |- | ||
|Daily Production Export | |Daily Production Export | ||
| − | | | + | | Provides a excel document that shows production and pressure with remarks per day by site along with API. |
| + | |||
| + | There are 3 total variants for this task. | ||
| + | |[[File:Manage Schedule Tasks Daily Prod Export.png|thumbnail]] | ||
|- | |- | ||
|Daily Production Report | |Daily Production Report | ||
| − | | | + | | |
| + | |||
| + | There are 3 total variants for this task. | ||
| + | |[[File:Manage Schedule Tasks Daily Prod Report.png|thumbnail]] | ||
|- | |- | ||
|Daily Production Variance Report | |Daily Production Variance Report | ||
Revision as of 22:11, 2 July 2019
Below are all Canned and Custom tasks available in PRAMS.
If there is a custom report that is not available in your installation please contact PRAMS for more details. Phone Number: 303-904-6855
Canned 'Built-In' Reports
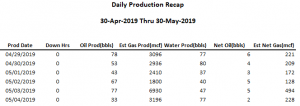
| 30 Production Recap | A snapshot of the last 30 days from a given date. | |
| 7 Day Prod/w Cums | Will display the last seven days with average, total production, and monthly cum. | |
| Auto Fill Daily Shut In | This task will fill in the gauge sheet in PumperX2 if the day previous has 24 hours down and is Shut In.
It will generate a report that shows the count of how many sites this was applied to. |
|
| Custody vs Check Report | Showing the last 7 days of production for sales compared to the check meter reading.
Will provide a difference in total MCF and in %. |
|
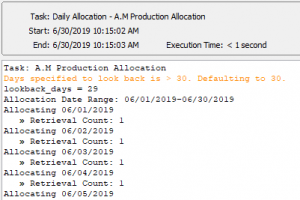
| Daily Allocation | Automatically runs allocation for anything that is set up to allocate. Can be set up to run Once, Daily, Weekly, or Monthly.
Can be set to Default or Enhanced logging. |
|
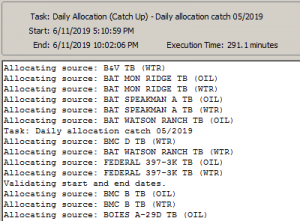
| Daily Allocation (Catch Up) | Allocates all or user set sites for one month set in a date rage as mm/02/yy - mm/01/yy. The more sites, the longer this allocation will run.
Set this allocation to run monthly towards the end of the work day. Can be set to Default or Enhanced logging. |
|
| Daily Flare Report | Will send a report that will show total flared volume broken down by site. Also shows the previous volume total. | |
| Daily Injection Report | Will generate a report that will show the injected volume, hours on, remarks, tubing pressure, and casing pressure. | |
| Daily Production (Simple) | A simplified version of Daily Production Report, that shows hours on/off, daily volumes, pressures, stroke data, and remarks. | |
| Daily Production Alert | Will show any set triggers set in Global Settings. | |
| Daily Production Charts | Displays a report that shows the production data for a site. The data displayed is a year back from the date specified.
There are 5 total variants for this task and supports logo use. |
|
| Daily Production Export | Provides a excel document that shows production and pressure with remarks per day by site along with API.
There are 3 total variants for this task. |
|
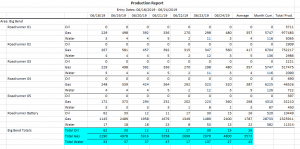
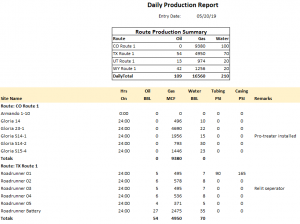
| Daily Production Report |
There are 3 total variants for this task. |
|
| Daily Production Variance Report | ||
| Daily Tank Levels | ||
| Gas Prod/Downtime Report | ||
| Gauge Sheets | ||
| Line Pressure Alert | ||
| Mail Grab | ||
| Off Trend Alert | ||
| Oil Prod/Downtime Report | ||
| Production By Day | ||
| Tests By Day | ||
| Weekly Production Report | ||
| Weekly Production Review | ||
| Weekly Production Variance | ||
| Weekly Single Product Report | ||
| Well Test Exception | ||
| Well Water Create | ||
Custom Reports
| Daily Exec Summary (CCI) | |
| Daily Production Report (DJR) | |
| Monthly Well Info (NPE) | |
