Difference between revisions of "List of Tasks"
| Line 9: | Line 9: | ||
{| class="wikitable" | {| class="wikitable" | ||
|- | |- | ||
| − | |30 Production Recap | + | | |
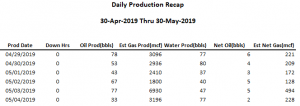
| − | | A snapshot of the last 30 days from a given date. | + | ====30 Production Recap==== |
| + | | A snapshot of the last 30 days from a given date. | ||
| + | |||
| + | No other variants than default, logo image unavailable. | ||
|[[File:30 Production Recap.png|center|thumbnail]] | |[[File:30 Production Recap.png|center|thumbnail]] | ||
|- | |- | ||
| − | |7 Day Prod/w Cums | + | | |
| + | ====7 Day Prod/w Cums==== | ||
| Will display the last seven days with average, total production, and monthly cum. | | Will display the last seven days with average, total production, and monthly cum. | ||
| + | |||
| + | Available Variants: Area, District, Field, Field Office, Route, and State. | ||
| + | |||
| + | All variants can be set to the Daily, Weekly, and Summary versions to coincide with what Run period is set for the correct title on a report. | ||
| + | |||
| + | Supports logo image use. | ||
| + | |||
|[[File:7 Day Prod With Cums.png|center|thumbnail]] | |[[File:7 Day Prod With Cums.png|center|thumbnail]] | ||
|- | |- | ||
| − | | | + | | |
| + | ====Auto Fill Daily Shut In==== | ||
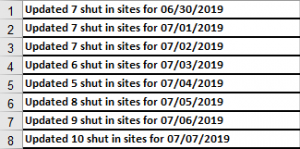
| This task will fill in the gauge sheet in PumperX2 if the day previous has 24 hours down and is Shut In. | | This task will fill in the gauge sheet in PumperX2 if the day previous has 24 hours down and is Shut In. | ||
| − | + | Generates a report that shows the count of how many sites this was applied to. | |
| + | |||
| + | Can be set to Default variant that will be on a daily run cycle and a Multi Day variant that will run on a weekly cycle. | ||
| + | |||
| + | Does not support logo image use. | ||
| + | |||
| + | | [[File:Manage Schedule Tasks Auto Fill Daily 1.png|center|thumbnail|Default Variant]][[File:Manage Schedule Tasks Auto Fill Daily 2.png|center|thumbnail|MultiDay Variant]] | ||
| + | |- | ||
| | | | ||
| − | + | ====Custody vs Check Report==== | |
| − | |||
| Showing the last 7 days of production for sales compared to the check meter reading. | | Showing the last 7 days of production for sales compared to the check meter reading. | ||
Will provide a difference in total MCF and in %. | Will provide a difference in total MCF and in %. | ||
| + | |||
| + | Does not support logo image use. | ||
|[[File:Custody vs Check Report.png|center|thumbnail]] | |[[File:Custody vs Check Report.png|center|thumbnail]] | ||
|- | |- | ||
| − | |Daily Allocation | + | | |
| + | ====Daily Allocation==== | ||
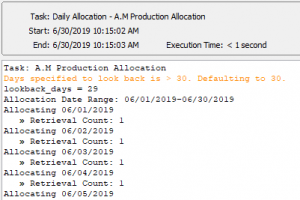
| Automatically runs allocation for anything that is set up to allocate. Can be set up to run Once, Daily, Weekly, or Monthly. | | Automatically runs allocation for anything that is set up to allocate. Can be set up to run Once, Daily, Weekly, or Monthly. | ||
| − | Can be set to Default or Enhanced logging. | + | Can be set to Default or Enhanced logging. Will not generate a report but can be viewed in the logs. |
|[[File:Manage Schedule Tasks Daily Alloc.png|center|thumbnail]] | |[[File:Manage Schedule Tasks Daily Alloc.png|center|thumbnail]] | ||
|- | |- | ||
| − | |Daily Allocation (Catch Up) | + | | |
| + | ====Daily Allocation (Catch Up)==== | ||
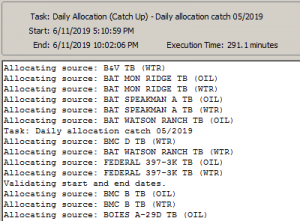
| Allocates all or user set sites for one month set in a date rage as mm/02/yy - mm/01/yy. The more sites, the longer this allocation will run. | | Allocates all or user set sites for one month set in a date rage as mm/02/yy - mm/01/yy. The more sites, the longer this allocation will run. | ||
| Line 43: | Line 65: | ||
|[[File:Manage Schedule Tasks Daily Alloc Catch Up.png|center|thumbnail]] | |[[File:Manage Schedule Tasks Daily Alloc Catch Up.png|center|thumbnail]] | ||
|- | |- | ||
| − | |Daily Flare Report | + | | |
| + | ====Daily Flare Report==== | ||
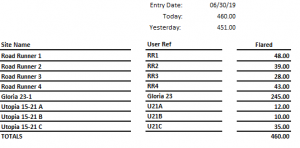
| Will send a report that will show total flared volume broken down by site. Also shows the previous volume total. | | Will send a report that will show total flared volume broken down by site. Also shows the previous volume total. | ||
|[[File:Manage Schedule Tasks Daily Flare Report.png|center|thumbnail]] | |[[File:Manage Schedule Tasks Daily Flare Report.png|center|thumbnail]] | ||
|- | |- | ||
| − | |Daily Injection Report | + | | |
| + | ====Daily Injection Report==== | ||
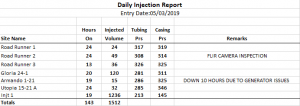
| Will generate a report that will show the injected volume, hours on, remarks, tubing pressure, and casing pressure. | | Will generate a report that will show the injected volume, hours on, remarks, tubing pressure, and casing pressure. | ||
|[[File:Manage Schedule Tasks Daily Inj Report.png|center|thumbnail]] | |[[File:Manage Schedule Tasks Daily Inj Report.png|center|thumbnail]] | ||
|- | |- | ||
| − | |Daily Production (Simple) | + | | |
| + | ====Daily Production (Simple)==== | ||
| A simplified version of Daily Production Report, that shows hours on/off, daily volumes, pressures, stroke data, and remarks. | | A simplified version of Daily Production Report, that shows hours on/off, daily volumes, pressures, stroke data, and remarks. | ||
|[[File:Manage Schedule Tasks Daily Simple.png|center|thumbnail]] | |[[File:Manage Schedule Tasks Daily Simple.png|center|thumbnail]] | ||
|- | |- | ||
| − | |Daily Production Alert | + | | |
| + | ====Daily Production Alert==== | ||
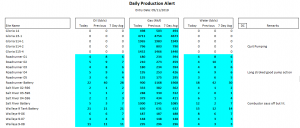
| Will show any set triggers set in [[Global Settings]]. | | Will show any set triggers set in [[Global Settings]]. | ||
|[[File:Manage Schedule Tasks Daily Prod Alert.png|center|thumbnail]] | |[[File:Manage Schedule Tasks Daily Prod Alert.png|center|thumbnail]] | ||
|- | |- | ||
| − | |Daily Production Charts | + | | |
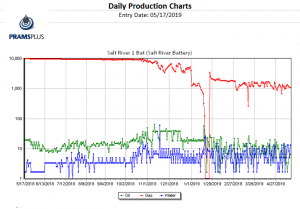
| + | ====Daily Production Charts==== | ||
| Displays a report that shows the production data for a site. The data displayed is a year back from the date specified. | | Displays a report that shows the production data for a site. The data displayed is a year back from the date specified. | ||
| Line 65: | Line 92: | ||
|[[File:Manage Schedule Tasks Daily Prod Charts.png|center|thumbnail]] | |[[File:Manage Schedule Tasks Daily Prod Charts.png|center|thumbnail]] | ||
|- | |- | ||
| − | |Daily Production Export | + | | |
| + | ====Daily Production Export==== | ||
| Provides a excel document that shows production and pressure with remarks per day by site along with API. | | Provides a excel document that shows production and pressure with remarks per day by site along with API. | ||
| Line 71: | Line 99: | ||
|[[File:Manage Schedule Tasks Daily Prod Export.png|center|thumbnail]] | |[[File:Manage Schedule Tasks Daily Prod Export.png|center|thumbnail]] | ||
|- | |- | ||
| − | |Daily Production Report | + | | |
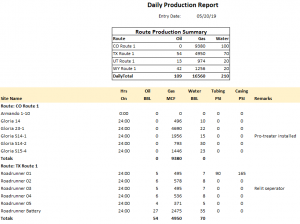
| + | ====Daily Production Report==== | ||
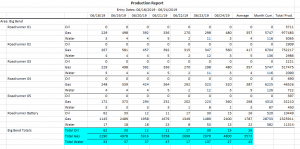
| Will provide a report summary based on set variant that will show a total summary at the top with individual broken down summaries below. | | Will provide a report summary based on set variant that will show a total summary at the top with individual broken down summaries below. | ||
| Line 79: | Line 108: | ||
|[[File:Manage Schedule Tasks Daily Prod Report.png|center|thumbnail]] | |[[File:Manage Schedule Tasks Daily Prod Report.png|center|thumbnail]] | ||
|- | |- | ||
| − | |Daily Production Variance Report | + | | |
| + | ====Daily Production Variance Report==== | ||
| Shows daily production set by variant compared against the 30 day average of the site for oil, gas, and water. | | Shows daily production set by variant compared against the 30 day average of the site for oil, gas, and water. | ||
| Line 85: | Line 115: | ||
|[[File:Manage Schedule Tasks Daily Prod variance.png|center|thumbnail]] | |[[File:Manage Schedule Tasks Daily Prod variance.png|center|thumbnail]] | ||
|- | |- | ||
| − | |Daily Tank Levels | + | | |
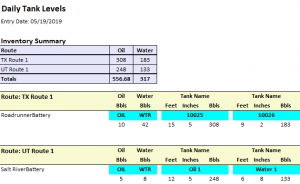
| + | ====Daily Tank Levels==== | ||
| Provides an inventory summary broken down by route that shows the daily gauge for each tank and the total stock it has accumulated. | | Provides an inventory summary broken down by route that shows the daily gauge for each tank and the total stock it has accumulated. | ||
|[[File:Manage Schedule Tasks Daily Tank Levels.png|center|thumbnail]] | |[[File:Manage Schedule Tasks Daily Tank Levels.png|center|thumbnail]] | ||
|- | |- | ||
| − | |Gas Prod/Downtime Report | + | | |
| + | ====Gas Prod/Downtime Report==== | ||
| Takes the days produced gas production and compares it to the prior day showing the difference. Takes the downtime hours and sums it by set variant. | | Takes the days produced gas production and compares it to the prior day showing the difference. Takes the downtime hours and sums it by set variant. | ||
| Line 95: | Line 127: | ||
|[[File:Manage Schedule Tasks Daily Prod and Downtime.png|center|thumbnail]] | |[[File:Manage Schedule Tasks Daily Prod and Downtime.png|center|thumbnail]] | ||
|- | |- | ||
| − | |Gauge Sheets | + | | |
| + | ====Gauge Sheets==== | ||
| Will provide the selected site gauge sheets for the previous month or for the current month as it progresses. | | Will provide the selected site gauge sheets for the previous month or for the current month as it progresses. | ||
|[[File:Manage Schedule Tasks Gauge Sheets.png|center|thumbnail]] | |[[File:Manage Schedule Tasks Gauge Sheets.png|center|thumbnail]] | ||
|- | |- | ||
| − | |Line Pressure Alert | + | | |
| + | ====Line Pressure Alert==== | ||
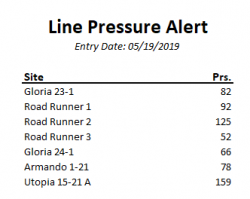
| Will display any site that is over the threshold set when setting up the task. | | Will display any site that is over the threshold set when setting up the task. | ||
|[[File:Manage Schedule Tasks Line Pressure Alert.png|center|thumbnail|250px]] | |[[File:Manage Schedule Tasks Line Pressure Alert.png|center|thumbnail|250px]] | ||
|- | |- | ||
| − | |Mail Grab | + | | |
| + | ====Mail Grab==== | ||
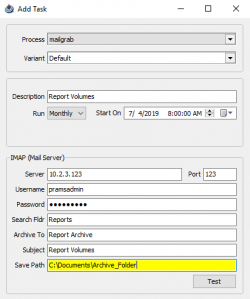
| Typically used to grab a SCADA file before import. | | Typically used to grab a SCADA file before import. | ||
| Line 109: | Line 144: | ||
|[[File:Manage Schedule Tasks Mail Grab.png|center|thumbnail|250px]] | |[[File:Manage Schedule Tasks Mail Grab.png|center|thumbnail|250px]] | ||
|- | |- | ||
| − | |Oil Prod/Downtime Report | + | | |
| + | ====Oil Prod/Downtime Report==== | ||
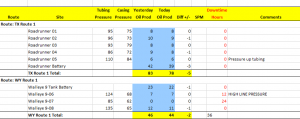
| Takes the days produced oil production and compares it to the prior day showing the difference. Takes the downtime hours and sums it by set variant. | | Takes the days produced oil production and compares it to the prior day showing the difference. Takes the downtime hours and sums it by set variant. | ||
|[[File:Manage Schedule Tasks Oil prod dt.png|thumbnail]] | |[[File:Manage Schedule Tasks Oil prod dt.png|thumbnail]] | ||
|- | |- | ||
| − | |Production By Day | + | | |
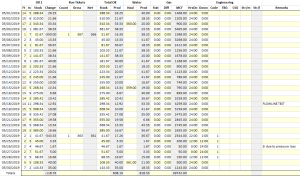
| + | ====Production By Day==== | ||
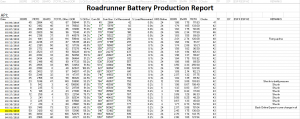
| A highly detailed report that provides either the first or last 120 days of production in the life of a site. Also provides a chart showing the 120 day progress. | | A highly detailed report that provides either the first or last 120 days of production in the life of a site. Also provides a chart showing the 120 day progress. | ||
| Line 120: | Line 157: | ||
|[[File:Manage Schedule Tasks Production by Day 1.png|center|thumbnail]][[File:Manage Schedule Tasks Production by Day 2.png|center|thumbnail]] | |[[File:Manage Schedule Tasks Production by Day 1.png|center|thumbnail]][[File:Manage Schedule Tasks Production by Day 2.png|center|thumbnail]] | ||
|- | |- | ||
| − | |Tests By Day | + | | |
| + | ====Tests By Day==== | ||
| A highly detailed report that provides either the first or last 120 days of daily well tests in the life of a site. Also provides a chart showing the 120 day progress. | | A highly detailed report that provides either the first or last 120 days of daily well tests in the life of a site. Also provides a chart showing the 120 day progress. | ||
| Line 126: | Line 164: | ||
|[[File:Manage Schedule Tasks Test by Day.png|center|thumbnail]] | |[[File:Manage Schedule Tasks Test by Day.png|center|thumbnail]] | ||
|- | |- | ||
| − | |Weekly Production Report | + | | |
| + | ====Weekly Production Report==== | ||
| Provides a snapshot of the week from the day ran with a 7 day average for oil , gas, and water. | | Provides a snapshot of the week from the day ran with a 7 day average for oil , gas, and water. | ||
| Line 132: | Line 171: | ||
|[[File:Manage Schedule Tasks Weekly Prod Report.png|center|thumbnail]] | |[[File:Manage Schedule Tasks Weekly Prod Report.png|center|thumbnail]] | ||
|- | |- | ||
| − | |Weekly Production Review | + | | |
| + | ====Weekly Production Review==== | ||
| Sums up each site by a variant for oil, gas, and water for the 7 day time frame also providing an average for each product. | | Sums up each site by a variant for oil, gas, and water for the 7 day time frame also providing an average for each product. | ||
|[[File:Manage Schedule Tasks Weekly Prod Report.png|center|thumbnail]] | |[[File:Manage Schedule Tasks Weekly Prod Report.png|center|thumbnail]] | ||
|- | |- | ||
| − | |Weekly Production Variance | + | | |
| + | ====Weekly Production Variance==== | ||
| | | | ||
|[[File:Manage Schedule Tasks Weekly Prod Variance.png|center|thumbnail]] | |[[File:Manage Schedule Tasks Weekly Prod Variance.png|center|thumbnail]] | ||
|- | |- | ||
| − | |Weekly Single Product Report | + | | |
| + | ====Weekly Single Product Report==== | ||
| Sums up each site by a single variant being oil, gas, or water for the 7 day time frame also providing an average for each product. | | Sums up each site by a single variant being oil, gas, or water for the 7 day time frame also providing an average for each product. | ||
Supports logo use. | Supports logo use. | ||
|[[File:Manage Schedule Tasks Weekly Single Prod Variance.png|center|thumbnail]] | |[[File:Manage Schedule Tasks Weekly Single Prod Variance.png|center|thumbnail]] | ||
|- | |- | ||
| − | |Well Test Exception | + | | |
| + | ====Well Test Exception==== | ||
| Compares yesterdays daily tests to the current days test and will report anything over the set threshold percentage. | | Compares yesterdays daily tests to the current days test and will report anything over the set threshold percentage. | ||
|[[|center|thumbnail]] | |[[|center|thumbnail]] | ||
| Line 169: | Line 212: | ||
|Well Water Create(Cobra) | |Well Water Create(Cobra) | ||
| Takes the water product from the source of one site and creates a new product at the target where the difference is the source minus the target. | | Takes the water product from the source of one site and creates a new product at the target where the difference is the source minus the target. | ||
| − | |[[File:Manage Schedule Tasks Well water Create.png|center|thumbnail]] | + | |[[File:Manage Schedule Tasks Well water Create.png|center|thumbnail|120px]] |
|- | |- | ||
|} | |} | ||
Revision as of 19:49, 8 July 2019
Below are all Canned and Custom tasks available in PRAMS.
If there is a custom report that is not available in your installation please contact PRAMS for more details. Phone Number: 303-904-6855
Contents
- 1 Canned 'Built-In' Reports
- 1.1 30 Production Recap
- 1.2 7 Day Prod/w Cums
- 1.3 Auto Fill Daily Shut In
- 1.4 Custody vs Check Report
- 1.5 Daily Allocation
- 1.6 Daily Allocation (Catch Up)
- 1.7 Daily Flare Report
- 1.8 Daily Injection Report
- 1.9 Daily Production (Simple)
- 1.10 Daily Production Alert
- 1.11 Daily Production Charts
- 1.12 Daily Production Export
- 1.13 Daily Production Report
- 1.14 Daily Production Variance Report
- 1.15 Daily Tank Levels
- 1.16 Gas Prod/Downtime Report
- 1.17 Gauge Sheets
- 1.18 Line Pressure Alert
- 1.19 Mail Grab
- 1.20 Oil Prod/Downtime Report
- 1.21 Production By Day
- 1.22 Tests By Day
- 1.23 Weekly Production Report
- 1.24 Weekly Production Review
- 1.25 Weekly Production Variance
- 1.26 Weekly Single Product Report
- 1.27 Well Test Exception
- 2 Custom Reports
Canned 'Built-In' Reports
30 Production Recap |
A snapshot of the last 30 days from a given date.
No other variants than default, logo image unavailable. |
|
7 Day Prod/w Cums |
Will display the last seven days with average, total production, and monthly cum.
Available Variants: Area, District, Field, Field Office, Route, and State. All variants can be set to the Daily, Weekly, and Summary versions to coincide with what Run period is set for the correct title on a report. Supports logo image use. |
|
Auto Fill Daily Shut In |
This task will fill in the gauge sheet in PumperX2 if the day previous has 24 hours down and is Shut In.
Generates a report that shows the count of how many sites this was applied to. Can be set to Default variant that will be on a daily run cycle and a Multi Day variant that will run on a weekly cycle. Does not support logo image use. |
|
Custody vs Check Report |
Showing the last 7 days of production for sales compared to the check meter reading.
Will provide a difference in total MCF and in %. Does not support logo image use. |
|
Daily Allocation |
Automatically runs allocation for anything that is set up to allocate. Can be set up to run Once, Daily, Weekly, or Monthly.
Can be set to Default or Enhanced logging. Will not generate a report but can be viewed in the logs. |
|
Daily Allocation (Catch Up) |
Allocates all or user set sites for one month set in a date rage as mm/02/yy - mm/01/yy. The more sites, the longer this allocation will run.
Set this allocation to run monthly towards the end of the work day. Can be set to Default or Enhanced logging. |
|
Daily Flare Report |
Will send a report that will show total flared volume broken down by site. Also shows the previous volume total. | |
Daily Injection Report |
Will generate a report that will show the injected volume, hours on, remarks, tubing pressure, and casing pressure. | |
Daily Production (Simple) |
A simplified version of Daily Production Report, that shows hours on/off, daily volumes, pressures, stroke data, and remarks. | |
Daily Production Alert |
Will show any set triggers set in Global Settings. | |
Daily Production Charts |
Displays a report that shows the production data for a site. The data displayed is a year back from the date specified.
There are 5 total variants for this task and supports logo use. |
|
Daily Production Export |
Provides a excel document that shows production and pressure with remarks per day by site along with API.
There are 3 total variants for this task. |
|
Daily Production Report |
Will provide a report summary based on set variant that will show a total summary at the top with individual broken down summaries below.
There are 16 total variants for this task. Supports logo use. |
|
Daily Production Variance Report |
Shows daily production set by variant compared against the 30 day average of the site for oil, gas, and water.
There are 12 total variants for this task. |
|
Daily Tank Levels |
Provides an inventory summary broken down by route that shows the daily gauge for each tank and the total stock it has accumulated. | |
Gas Prod/Downtime Report |
Takes the days produced gas production and compares it to the prior day showing the difference. Takes the downtime hours and sums it by set variant.
There are 7 total variants for this task. |
|
Gauge Sheets |
Will provide the selected site gauge sheets for the previous month or for the current month as it progresses. | |
Line Pressure Alert |
Will display any site that is over the threshold set when setting up the task. | |
Mail Grab |
Typically used to grab a SCADA file before import.
This task can go to a specific email set to search a subject line (set in Subject) to save any attachments to a specified folder path then archive withing the email account. |
|
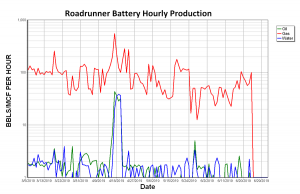
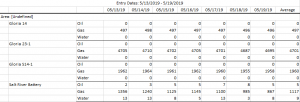
Oil Prod/Downtime Report |
Takes the days produced oil production and compares it to the prior day showing the difference. Takes the downtime hours and sums it by set variant. | |
Production By Day |
A highly detailed report that provides either the first or last 120 days of production in the life of a site. Also provides a chart showing the 120 day progress.
Multiple sites will be stored in tabs in the bottom of the excel document. |
|
Tests By Day |
A highly detailed report that provides either the first or last 120 days of daily well tests in the life of a site. Also provides a chart showing the 120 day progress.
Multiple sites will be stored in tabs in the bottom of the excel document. |
|
Weekly Production Report |
Provides a snapshot of the week from the day ran with a 7 day average for oil , gas, and water.
Supports logo use. |
|
Weekly Production Review |
Sums up each site by a variant for oil, gas, and water for the 7 day time frame also providing an average for each product. | |
Weekly Production Variance |
||
Weekly Single Product Report |
Sums up each site by a single variant being oil, gas, or water for the 7 day time frame also providing an average for each product.
Supports logo use. |
|
Well Test Exception |
Compares yesterdays daily tests to the current days test and will report anything over the set threshold percentage. | [[|center|thumbnail]] |
Custom Reports
| Daily Exec Summary (CCI) | ||
| Daily Production Report (DJR) | ||
| Monthly Well Info (NPE) | ||
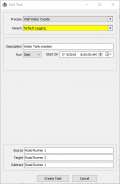
| Well Water Create(Cobra) | Takes the water product from the source of one site and creates a new product at the target where the difference is the source minus the target. |
