Difference between revisions of "Monthly Reports Tool"
m |
m |
||
| (6 intermediate revisions by the same user not shown) | |||
| Line 1: | Line 1: | ||
''Provides multiple styles of Monthly Reports that can be filtered down by criteria and by site.'' | ''Provides multiple styles of Monthly Reports that can be filtered down by criteria and by site.'' | ||
---- | ---- | ||
| + | ◄ [[Analyst Overview]] | ||
'''''AnalystX2 and InsightX2 are both capable of using this tool.''''' | '''''AnalystX2 and InsightX2 are both capable of using this tool.''''' | ||
| Line 14: | Line 15: | ||
To create a report follow the steps for filtering the report type and sites. | To create a report follow the steps for filtering the report type and sites. | ||
| − | <u>'''Step 1'''</u> | + | <u>'''Step 1 Select the Report Type'''</u> |
| − | <u>'''Step 2'''</u> | + | |
| − | <u>'''Step 3'''</u> | + | There are many different types of reports that can be selected, to view an example of each can be found at the bottom of this page. |
| − | <u>'''Step 4'''</u> | + | |
| + | Depending on the selected report, certain options will be presented. | ||
| + | |||
| + | Select Oil, Gas or both. | ||
| + | |||
| + | *'''Report at a State Pressure Base''' - This will show all numerical totals as what the state requires not what it is under site maintenance. | ||
| + | |||
| + | *'''Include Plant Inlet As sales''' - This will take into account any plant inlet volume as a sale rather than apply the numbers to its own Plant Inlet column | ||
| + | |||
| + | *'''Include Plant Residue as Sales''' - This will take into account any plant residue volume as a sale rather than apply the numbers to its own Plant Residue column | ||
| + | |||
| + | <u>'''Step 2 Specify Filters For Site Selection'''</u> | ||
| + | |||
| + | This step will allow you to filter the selected report by Analyst, Site Type, Operator, State, Field, Foreman, and Area. | ||
| + | |||
| + | As you are filtering you will see the list of sites decrease in count to the right. | ||
| + | |||
| + | <u>'''Step 3 Specify Sites to Report on '''</u> | ||
| + | |||
| + | Here you can select the period for the month that you want to pull in mm/yyyy format. | ||
| + | |||
| + | By default all sites will be selected and the check-marks near the top will allow you to de-select all or re-select all. | ||
| + | |||
| + | Note that if "Use Internal Reporting Dates" has been checked it will only pull sites that have an active date setup in Site Maintenance for the period selected. | ||
| + | |||
| + | |||
| + | <u>'''Step 4 Create the Report'''</u> | ||
| + | |||
| + | The last step is to select what your first column will be. | ||
| + | |||
| + | You can show the site as its user_ref, Name & Number, and Acct or Econ Xref | ||
| + | |||
| + | The report will generate in Prams before allowing the option to export to Excel or Pdf. | ||
| + | |||
| + | If the report doesn't look satisfactory you can then select back and change the options around. | ||
| + | |||
| + | Selecting a new report will not reset the other filters. | ||
| + | |||
| + | There currently isn't a way to save the filters and selections. Its recommended to remember your selections. | ||
| + | |||
| + | |||
| + | ===<u>'''Report Examples'''</u>=== | ||
| + | |||
| + | Below are examples of each of the report options. | ||
| + | |||
| + | '''Production And Disposition''' | ||
| + | |||
| + | [[File:InsightX2 - Monthly Reports - Prod and Disp.png|border|800px]] | ||
| + | |||
| + | |||
| + | '''Production And Disposition Oil''' | ||
| + | |||
| + | [[File:InsightX2 - Monthly Reports - Prod and Disp Oil.png|border|500px]] | ||
| + | |||
| + | '''Production And Disposition Gas''' | ||
| + | |||
| + | [[File:InsightX2 - Monthly Reports - Prod and Disp Gas.png|border|500px]] | ||
| + | |||
| + | '''Allocation Results''' | ||
| + | |||
| + | [[File:InsightX2 - Monthly Reports - Allocation Results.png|border|800px]] | ||
| + | |||
| + | '''Injection Report''' | ||
| + | |||
| + | [[File:InsightX2 - Monthly Reports - Injection Report.png|border|500px]] | ||
| + | |||
| + | '''Ticket Summary''' | ||
| + | |||
| + | [[File:InsightX2 - Monthly Reports - Ticket Summary.png|border|700px]] | ||
| + | |||
| + | '''Production History''' | ||
| + | |||
| + | [[File:InsightX2 - Monthly Reports - Production History.png|border|900px]] | ||
| + | |||
| + | '''Sales History''' | ||
| + | |||
| + | [[File:InsightX2 - Monthly Reports - Sales History.png|border|900px]] | ||
| + | |||
| + | '''Production And Disposition History''' | ||
| + | |||
| + | [[File:InsightX2 - Monthly Reports - Production and Disp History.png|border|800px]] | ||
| + | |||
| + | '''Production And Sales History''' | ||
| + | |||
| + | [[File:InsightX2 - Monthly Reports - Production and Sales History.png|border|800px]] | ||
| + | |||
| + | |||
| + | |||
| + | |||
| + | |||
| + | |||
| + | |||
| + | |||
| + | |||
| + | |||
| + | Copyright © {{CURRENTYEAR}} by PRAMS Plus LLC. All Rights Reserved. | ||
Latest revision as of 21:14, 27 March 2020
Provides multiple styles of Monthly Reports that can be filtered down by criteria and by site.
AnalystX2 and InsightX2 are both capable of using this tool.
From AnalystX2 go to > Reports > Monthly Reports
From InsightX2 go to > Monthly Reports > Monthly Reports
Creating a Report
To create a report follow the steps for filtering the report type and sites.
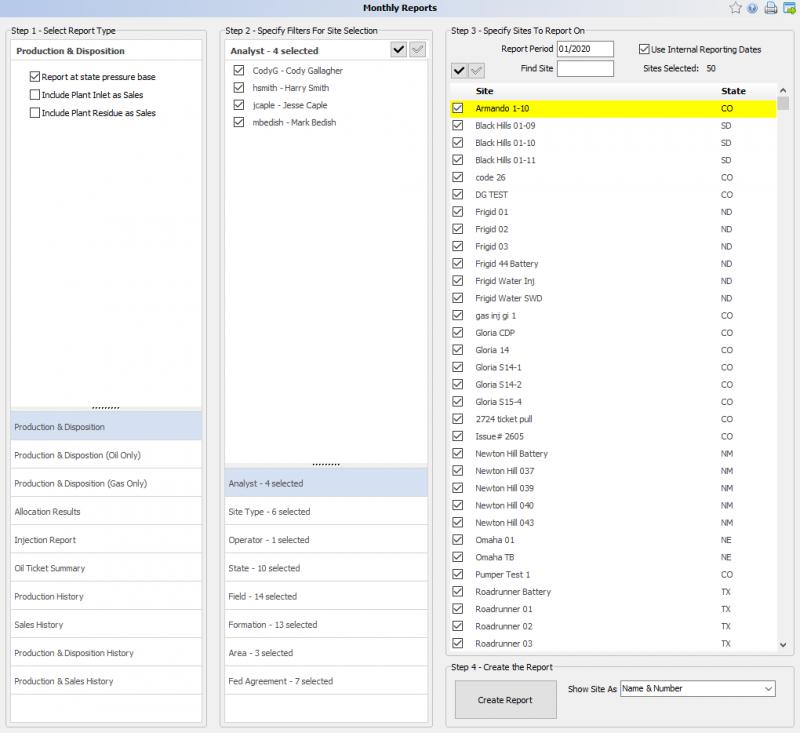
Step 1 Select the Report Type
There are many different types of reports that can be selected, to view an example of each can be found at the bottom of this page.
Depending on the selected report, certain options will be presented.
Select Oil, Gas or both.
- Report at a State Pressure Base - This will show all numerical totals as what the state requires not what it is under site maintenance.
- Include Plant Inlet As sales - This will take into account any plant inlet volume as a sale rather than apply the numbers to its own Plant Inlet column
- Include Plant Residue as Sales - This will take into account any plant residue volume as a sale rather than apply the numbers to its own Plant Residue column
Step 2 Specify Filters For Site Selection
This step will allow you to filter the selected report by Analyst, Site Type, Operator, State, Field, Foreman, and Area.
As you are filtering you will see the list of sites decrease in count to the right.
Step 3 Specify Sites to Report on
Here you can select the period for the month that you want to pull in mm/yyyy format.
By default all sites will be selected and the check-marks near the top will allow you to de-select all or re-select all.
Note that if "Use Internal Reporting Dates" has been checked it will only pull sites that have an active date setup in Site Maintenance for the period selected.
Step 4 Create the Report
The last step is to select what your first column will be.
You can show the site as its user_ref, Name & Number, and Acct or Econ Xref
The report will generate in Prams before allowing the option to export to Excel or Pdf.
If the report doesn't look satisfactory you can then select back and change the options around.
Selecting a new report will not reset the other filters.
There currently isn't a way to save the filters and selections. Its recommended to remember your selections.
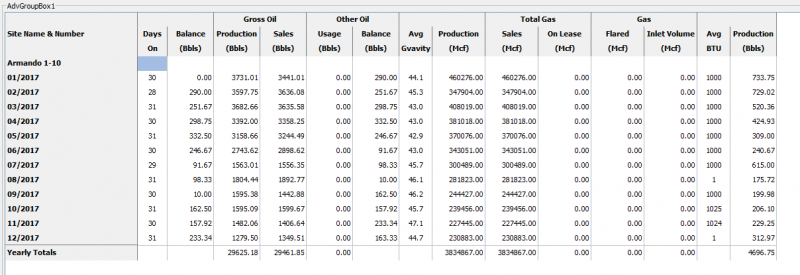
Report Examples
Below are examples of each of the report options.
Production And Disposition
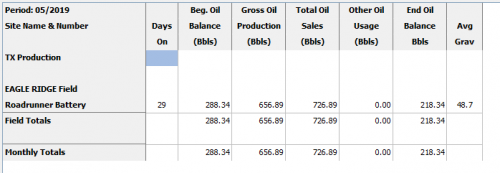
Production And Disposition Oil
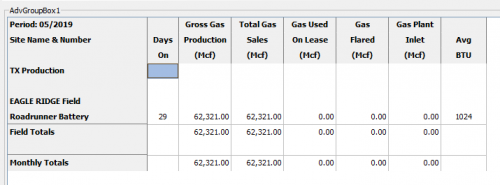
Production And Disposition Gas
Allocation Results
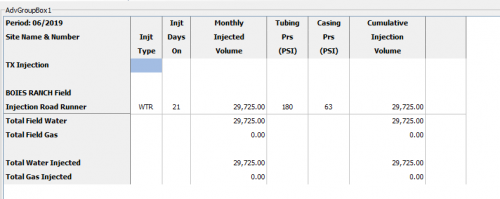
Injection Report
Ticket Summary
Production History
Sales History
Production And Disposition History
Production And Sales History
Copyright © 2026 by PRAMS Plus LLC. All Rights Reserved.
