Difference between revisions of "Daily Production Variance Report"
Jump to navigation
Jump to search
| Line 1: | Line 1: | ||
''This page will show the Simple 5,10,20,30,50% Variant report.'' | ''This page will show the Simple 5,10,20,30,50% Variant report.'' | ||
----- | ----- | ||
| + | [[File:Manage Schedule Tasks Daily Prod variance x.png|border|right]] | ||
| + | This report will show the different thresholds from what set as the variant percentage. | ||
| − | + | For oil, gas, and water it will take the 7 day average and compare the report day to show the variance. | |
| + | |||
| + | If it exceeds the threshold the cell with highlight with green for oil, red for gas, and blue for water. | ||
| + | |||
| + | |||
| + | |||
| + | |||
| + | |||
| + | |||
| + | |||
| + | |||
| + | |||
| + | |||
| + | |||
| + | |||
| + | |||
| + | |||
| + | Copyright © 2019 by PRAMS Plus LLC. All Rights Reserved. | ||
Revision as of 20:03, 31 July 2019
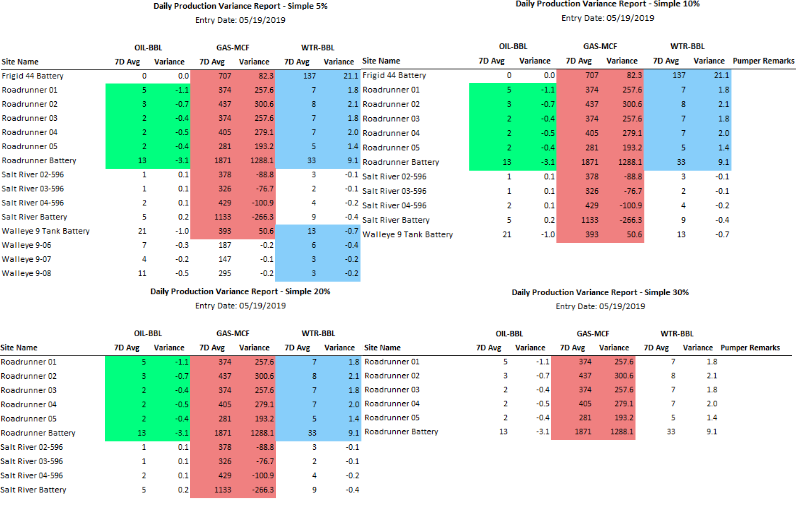
This page will show the Simple 5,10,20,30,50% Variant report.

This report will show the different thresholds from what set as the variant percentage.
For oil, gas, and water it will take the 7 day average and compare the report day to show the variance.
If it exceeds the threshold the cell with highlight with green for oil, red for gas, and blue for water.
Copyright © 2019 by PRAMS Plus LLC. All Rights Reserved.